A convolutional network estimates a hurricane's maximum sustained wind from a single infrared satellite frame.
Trained on 2,092 storm-centered crops from 15 Atlantic storms between 2018 and 2024, labeled against the NOAA best track.
9.00 kt
mean absolute error
393
frames, unseen storms
−19.5 kt
bias at category 4
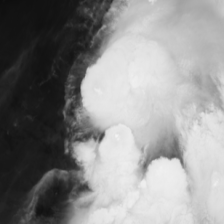
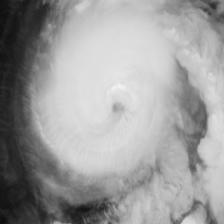
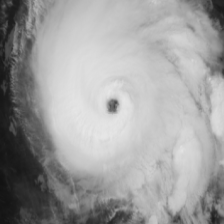
Hurricane Michael over roughly three days in October 2018, from a disorganized tropical storm to a category 5 at landfall. Every frame is centered on the best-track position and shown exactly as the network receives it, at 224 by 224 pixels. The middle label is interpolated between six-hourly fixes; the outer two are true fixes.
Method
- Parse the NOAA HURDAT2 best track, drop entries the record marks extratropical, and interpolate the six-hourly fixes to hourly.
- Match each position to the nearest GOES-16 ABI band 13 scan, accepting a time offset of up to ten minutes and logging it.
- Cut a 600 kilometer box around the storm center, working in the satellite's own fixed-grid projection so the box stays square on the ground.
- Clamp brightness temperature to 180–320 K, resize to 224 by 224, and regress wind speed directly with a ResNet-18.
- Split the data by storm rather than by frame. Hourly frames of the same storm are near-duplicates, so a random split would leak the answer.
Results
Three storms were held out entirely: Ian, Nicole and Claudette. The network never saw a frame of any of them during training.
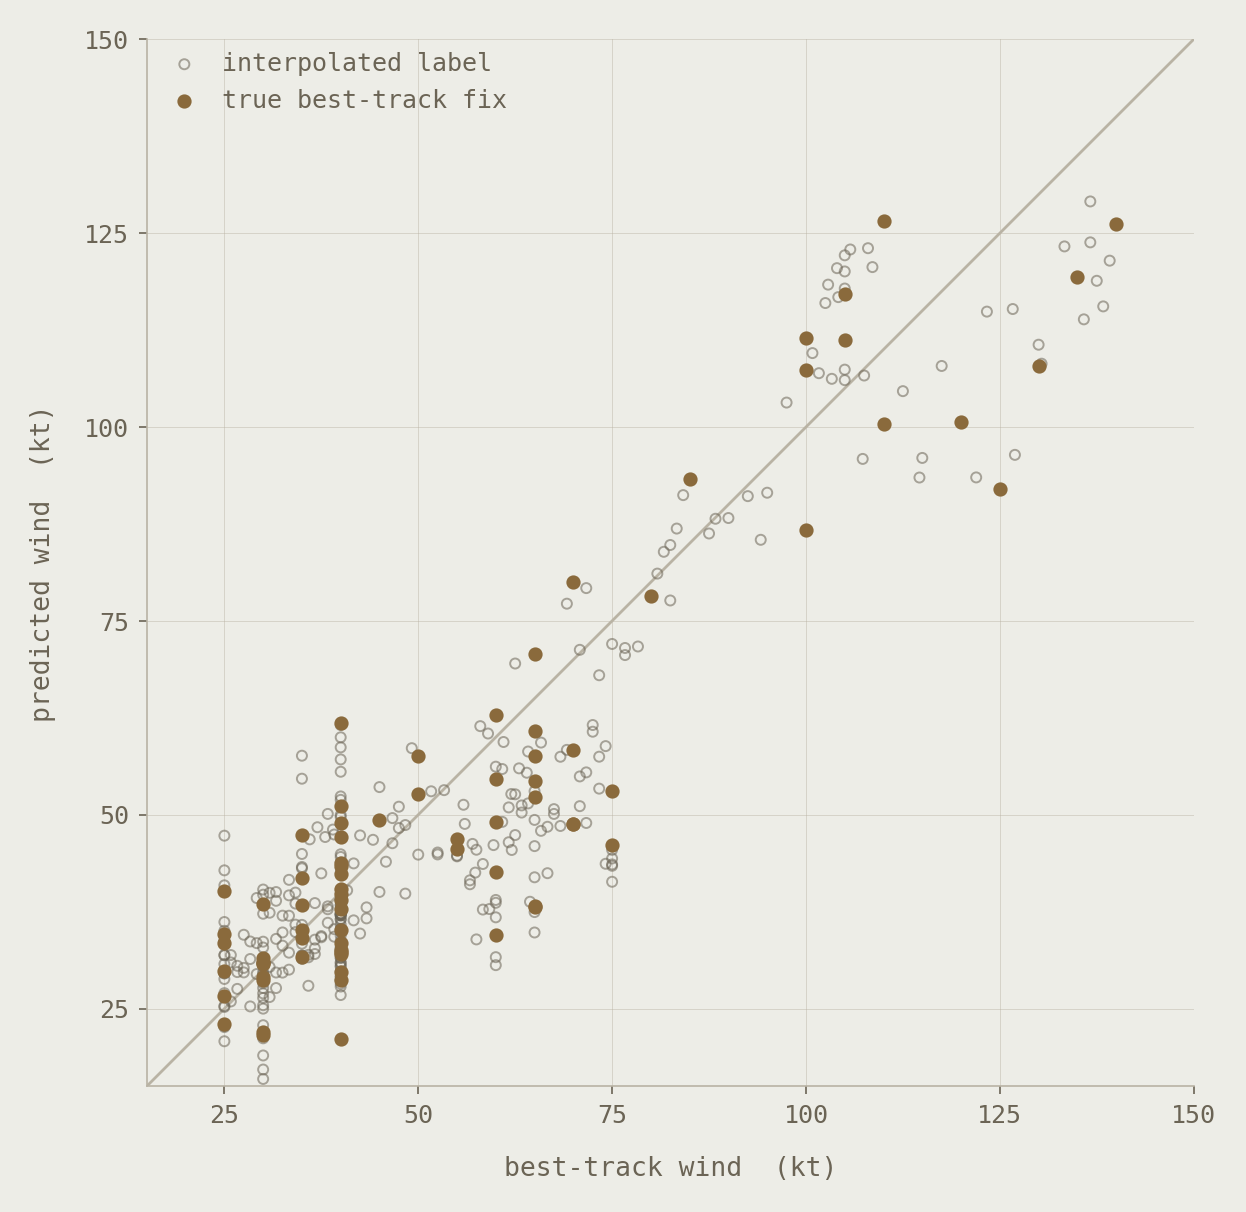
Each point is one frame. The diagonal is perfect agreement. Best-track winds are recorded in five-knot steps, which is why the points stand in columns. Interpolated labels are drawn open; the 77 true best-track fixes are filled.
| Category | Frames | MAE | Bias |
|---|---|---|---|
| Depression | 83 | 5.50 | +2.38 |
| Storm | 187 | 7.59 | −2.74 |
| Category 1 | 58 | 15.76 | −14.58 |
| Category 2 | 9 | 3.96 | +0.24 |
| Category 3 | 25 | 10.50 | +7.68 |
| Category 4 | 15 | 19.49 | −19.49 |
| Category 5 | 4 | 18.25 | −18.25 |
Knots. Bias is the mean signed error, so a negative figure means the network guessed low.
Hurricane Ian, hour by hour
- Best track
- Model
- Difference
- Label
- Time
best track
model
ticks mark true six-hourly fixes
Loading frames…
Every hour of Hurricane Ian, from a depression east of the Windward Islands on 22 September 2022 to landfall in South Carolina on 30 September. Ian was held out of training entirely, so every reading here is an out-of-sample estimate made from one frame. The model tracks the intensification closely, undershoots the peak by fourteen knots, then falls away faster than the storm does and stays about seventeen knots low through the weakening. Its line is the busier of the two because the best track is interpolated hourly between six-hourly fixes and can only bend in straight lines, while the model answers every frame on its own.
Where it fails
The network is accurate on weak systems and underestimates strong ones. At category 4 it reads a storm roughly 19 knots too low, and at category 5 about 18. Those bands hold 15 and 4 frames respectively, against 270 below hurricane strength, so the most likely explanation is that the model rarely saw a major hurricane and hedges toward the middle of the distribution it did see.
Category 1 is a separate problem. Its error is nearly as large, and most of those frames belong to Ian on either side of its rapid intensification, where the storm changed faster than a six-hourly best track resolves.
Both are testable, and neither is fixed here on purpose. Adding major hurricanes to the training set after seeing this failure would make the 9.00 knot figure difficult to trust, so it stands as a baseline and the class-imbalance experiment comes next, measured against it.